GROK Data Visualization
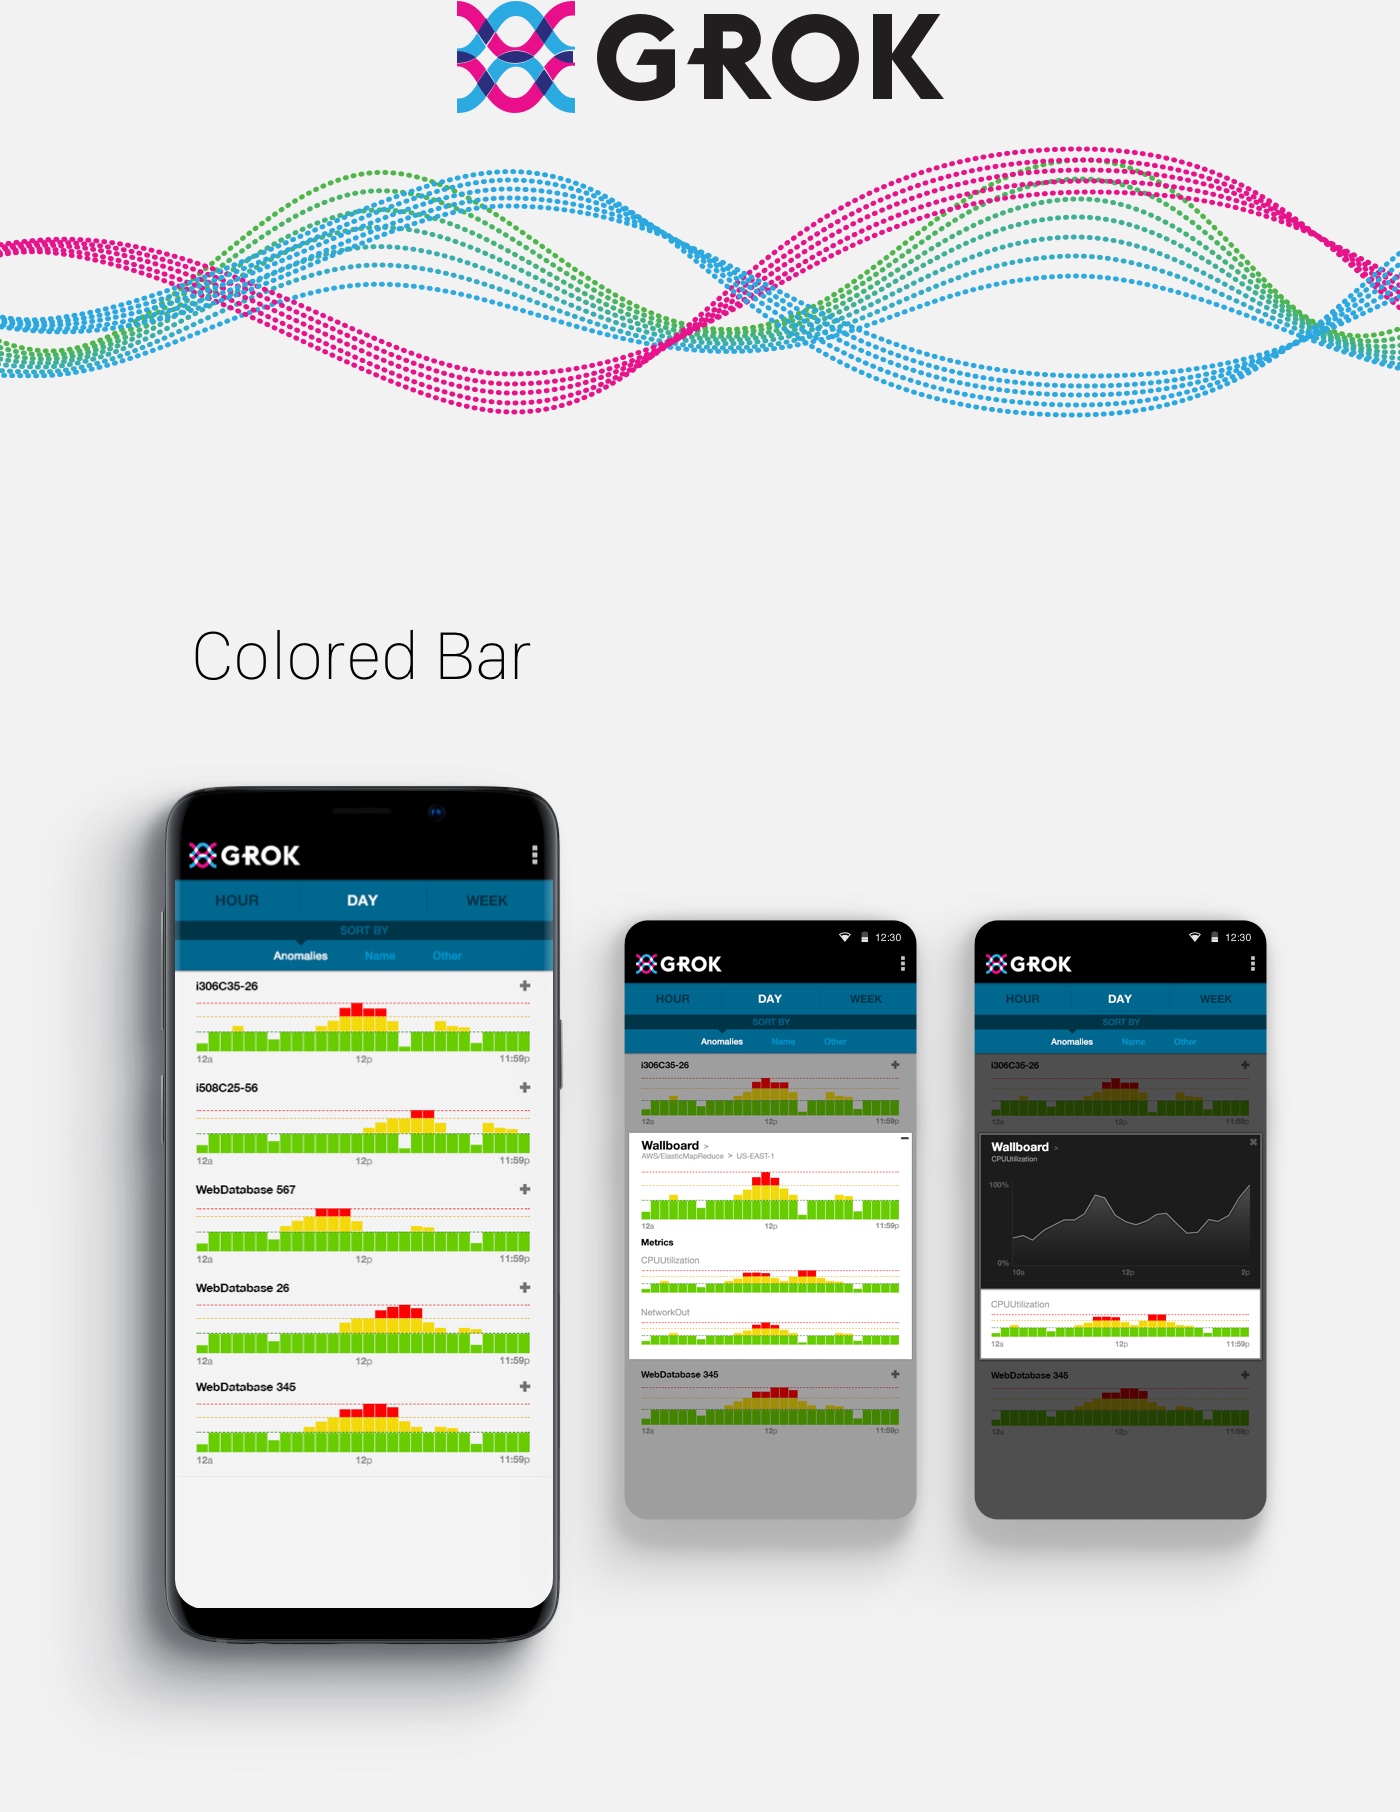
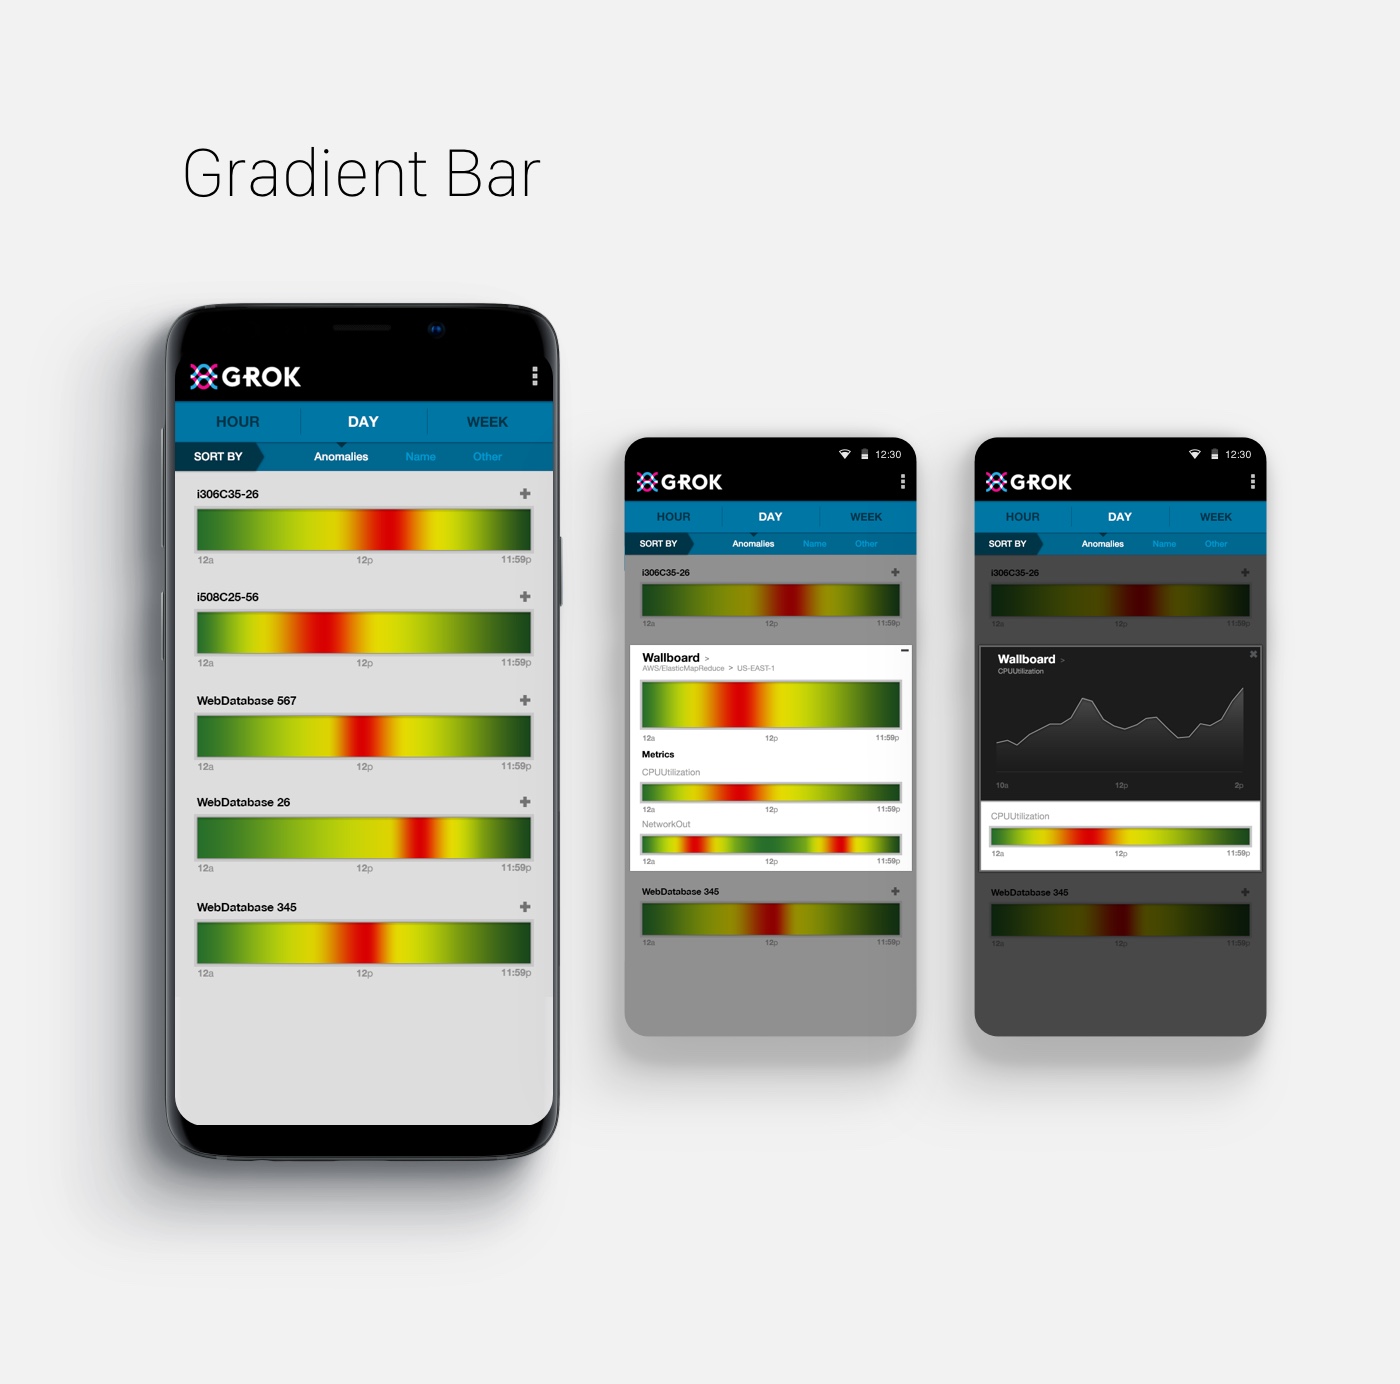
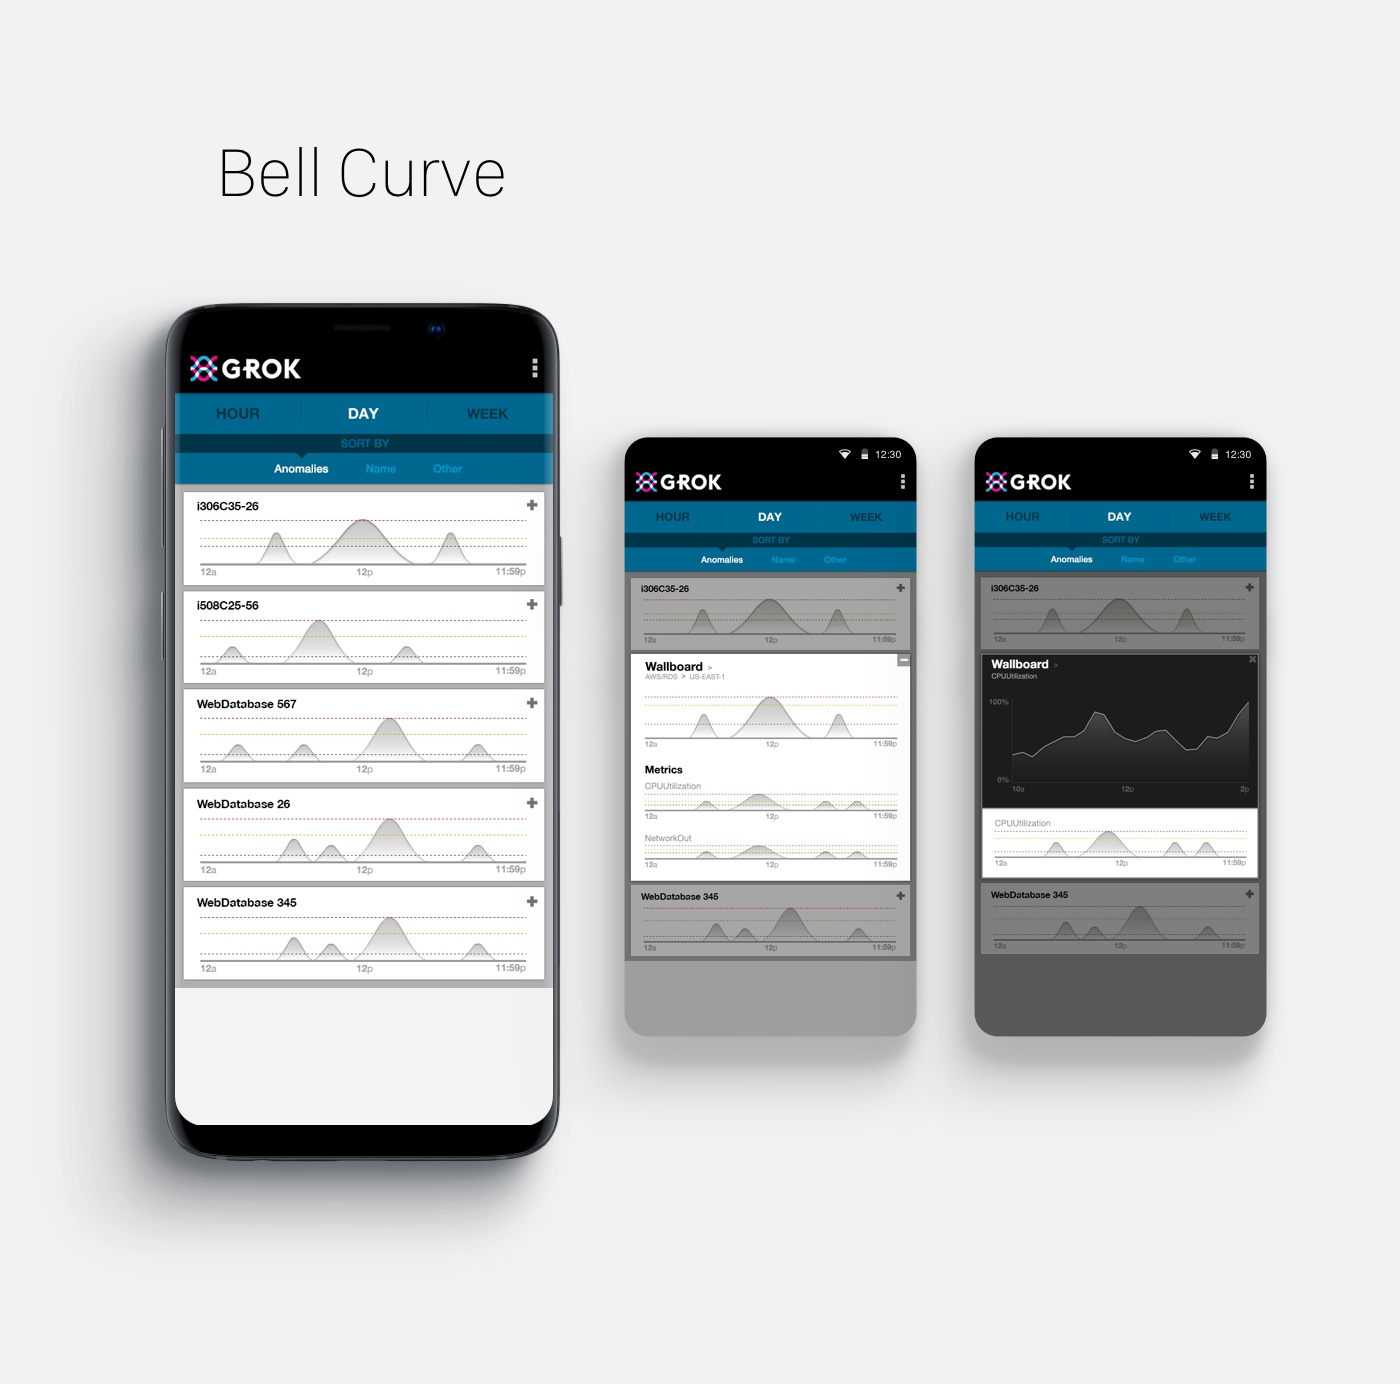
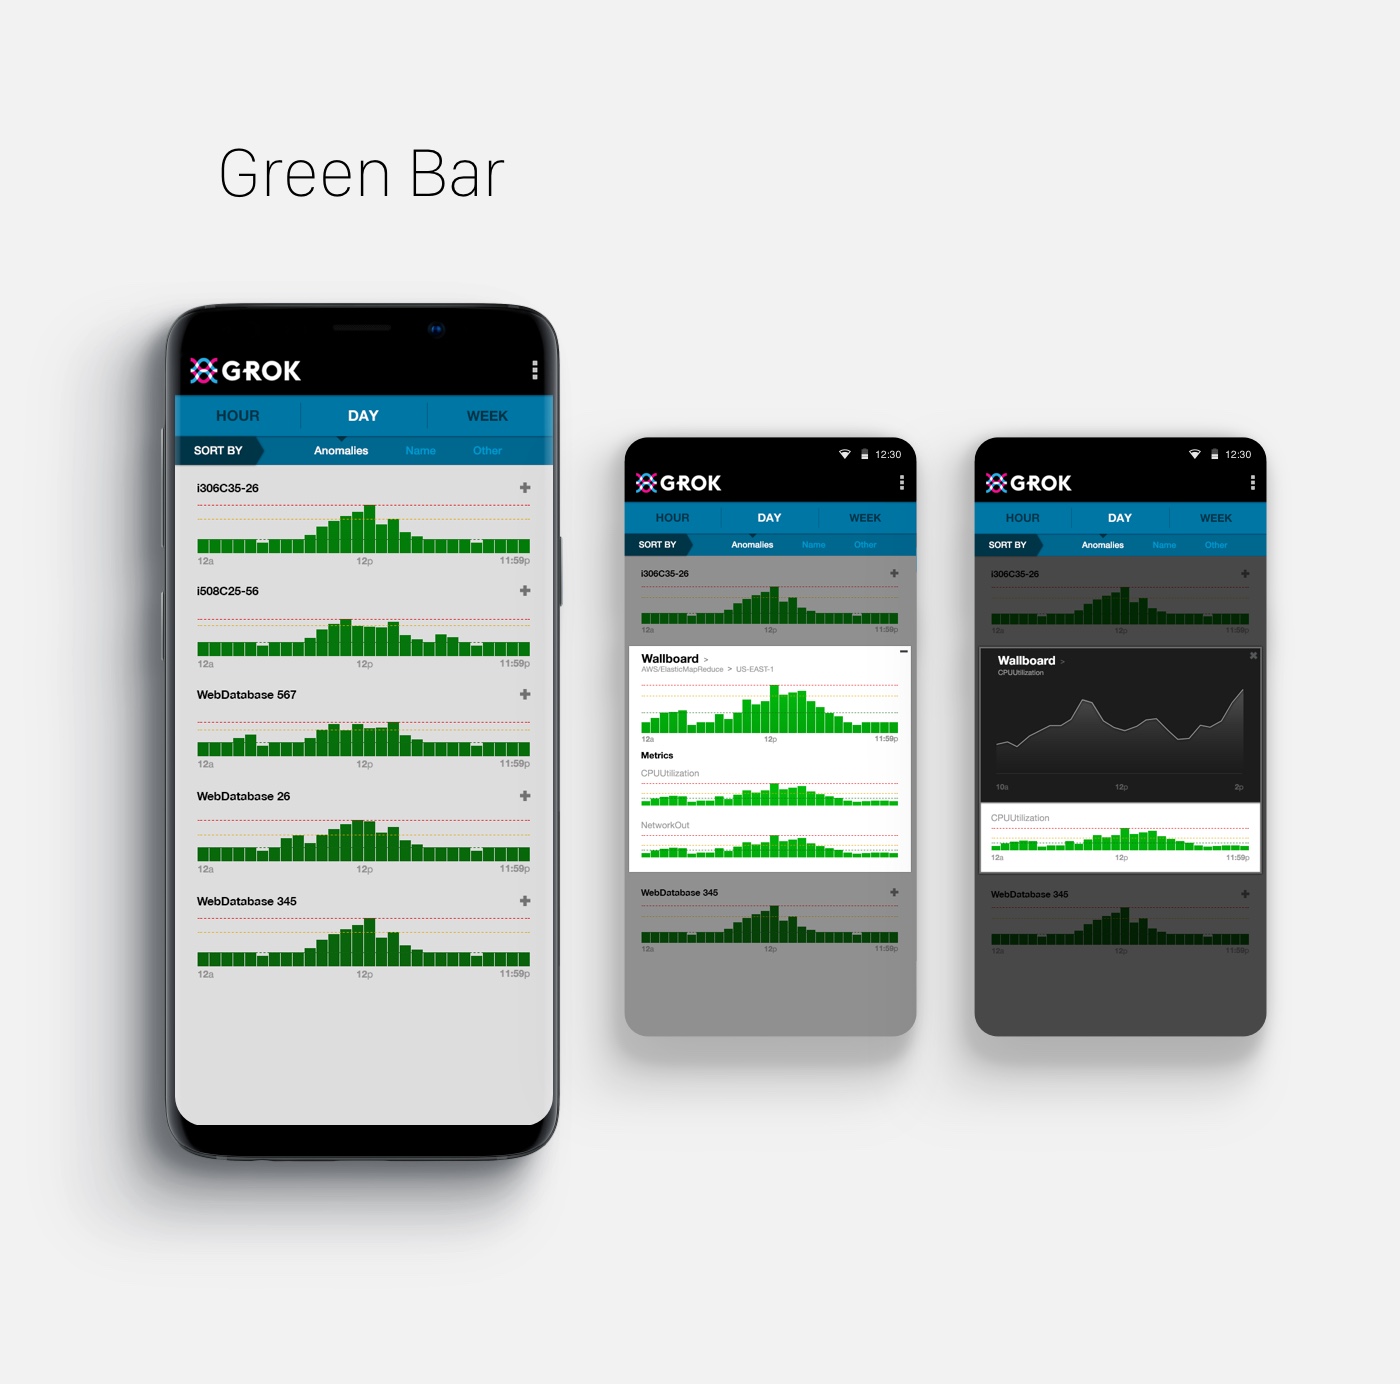
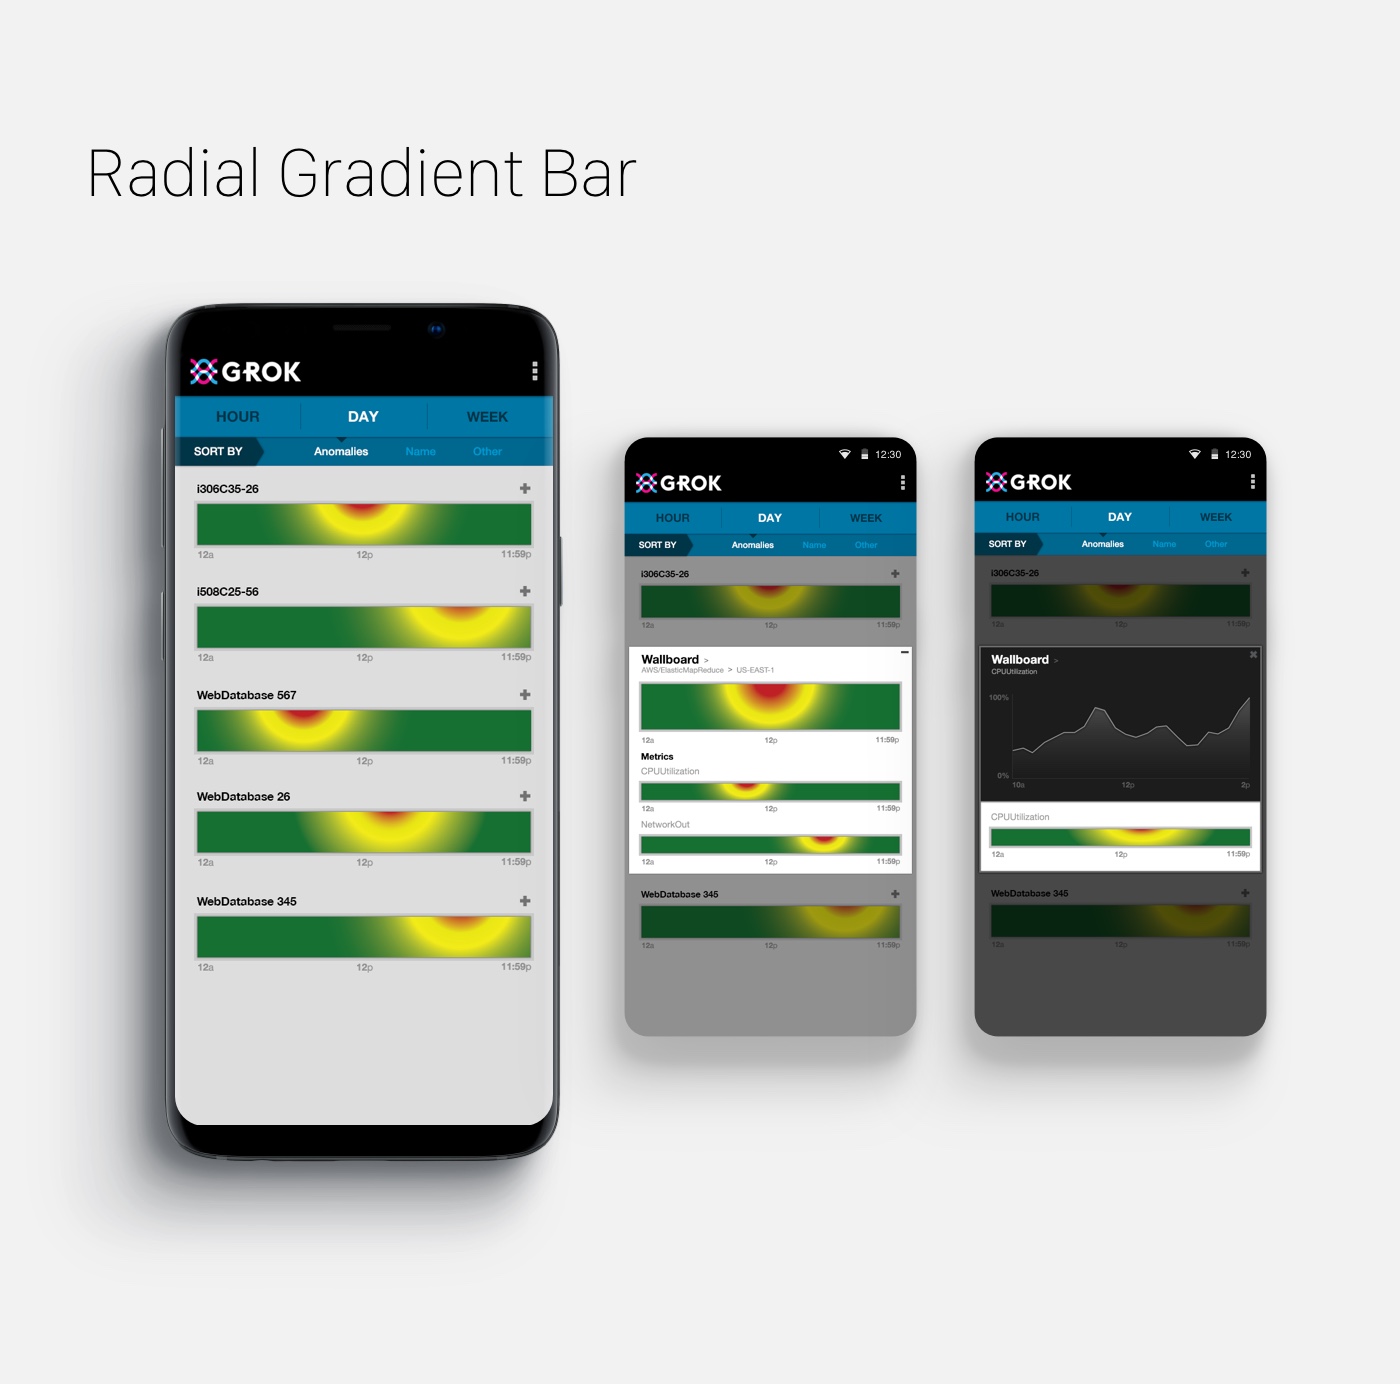
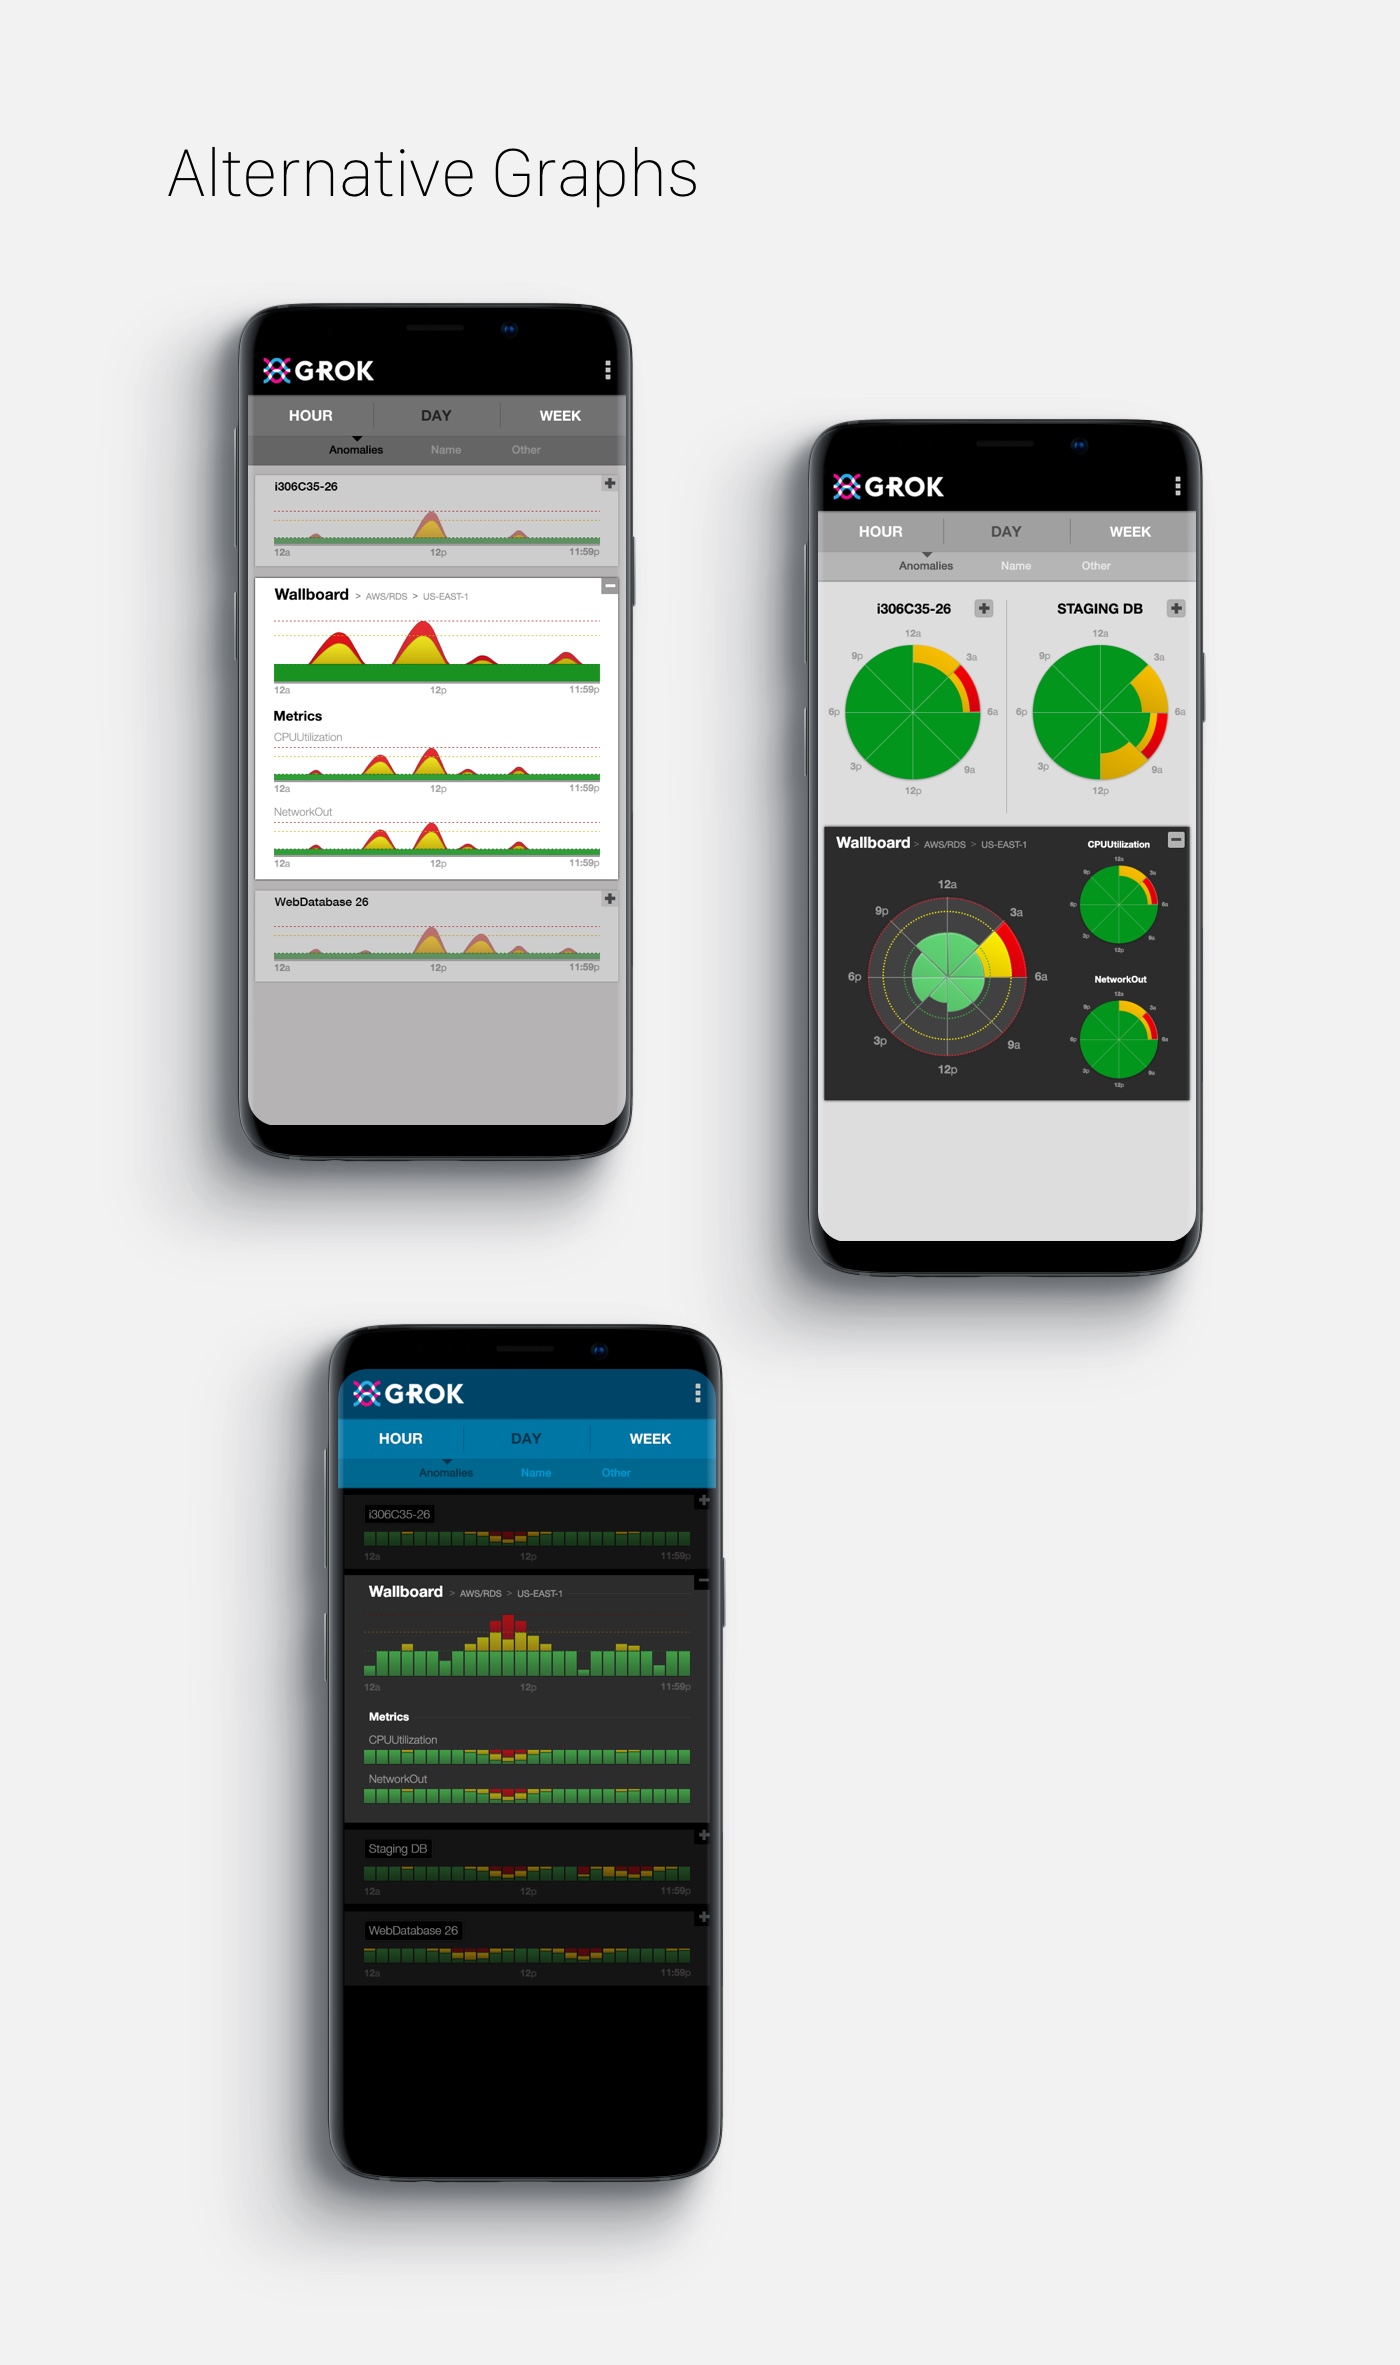
The data visualizations were part of the initial research and design phase. The challenge was to figure out which visualization pattern provided 100% accuracy in true form and function so the user can easily digest the meaning of the information that was being presented and make quick decisions after processing the results.
Deliverables
Mobile Application, Style Guide, Product Design, Visual Design, UI, UX, Prototyping, Typography, Color Theory, Branding, Interaction Design
Tools
Sketch, Illustrator, Android OS
Company![]()